WebSwing is a grid strategy for crypto assets. It enables automated trading on Binance through signal trading via TradingView webhooks. You are invited to use this strategy for $99 per month. Only paid TradingView users with webhook access (Essential plan or higher) can utilize it.
1. Automated Trading Structure
TradingView Strategy -> Alert -> Webhook -> Binance Signal Trading You can use Binance’s built-in signal trading feature without needing a webhook bot.
2. Backtesting
Recommended assets: Binance Cryptocurrencies Futures (Choose assets with low slippage and high liquidity, such as BTC, ETH, SOL, XRP, DOGE, etc.)
Recommended time frames: 4H, 8H, 12H (Avoid excessively short time frames.)
1) Inputs
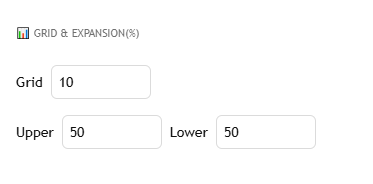
① GRID & EXPANSION
Grid : Number of grids to generate
Upper : Top grid expansion level (%)
Lower : Bottom grid expansion level (%)

② GRID METHOD
Method : The method to be used to generate the grid
Source : Method Variable
Length : Method Variable
BB Mult : BB Variable
Left Bars : Pivot Variable
Right Bars : Pivot Variable

③ TARGET & STOP
TP : Number of target grids
SL : Number of stop loss grids
Auto Stop : Sell when the grid goes down.

④ GRID FEATURES
Individual Grid Analysis : Test one grid.
Grid Filter : Select only the grids you want to trade.
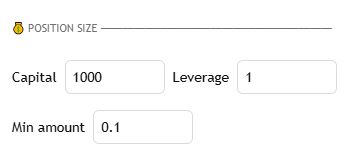
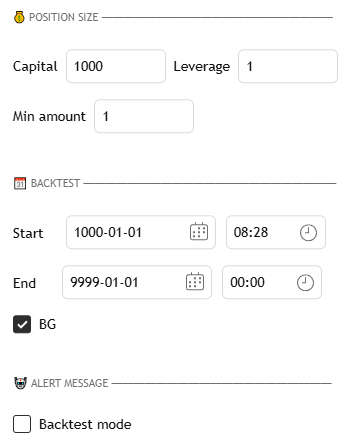
⑤ POSITION SIZE
Capital : Initial capital per candle for backtesting purposes.
Leverage : Defines the leverage level.
Min Amount : The minimum trade unit of the exchange for a more
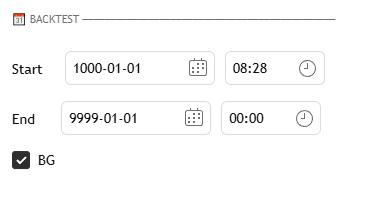
⑥ BACKTEST
Start / End : Defines the start and end dates of the backtest.
BG : Highlights the backtest period with a background color.
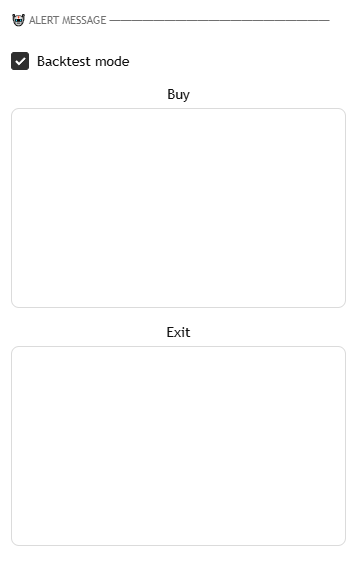
⑦ ALERT MESSAGE
Backtest Mode : Enabled for backtesting. Disabled when receiving live alerts to avoid capital misalignment between the strategy and actual exchange assets.
Buy : Alert message when a buy signal occurs.
Exit : Alert message when a sell signal occurs.
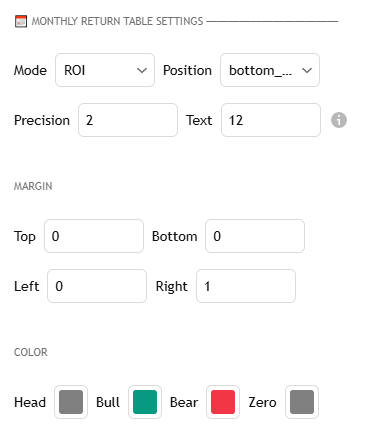
⑧ MONTHLY RETURN TABLE SETTINGS
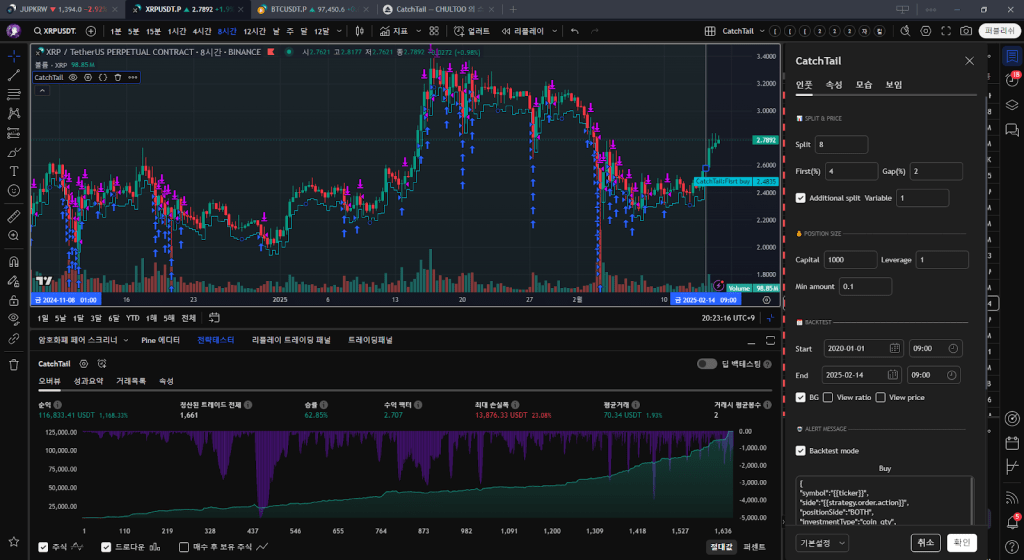
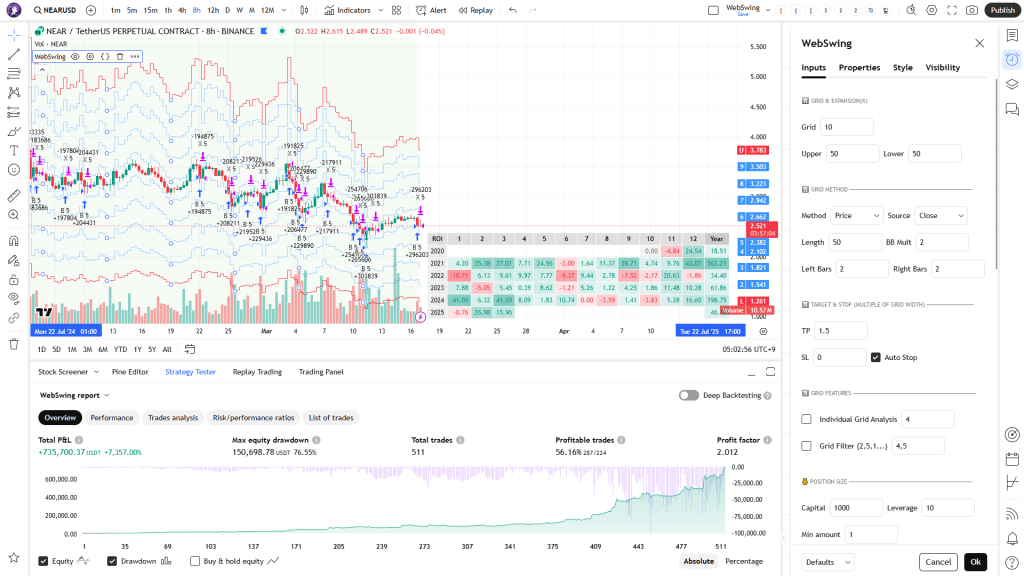
2) Strategy Tester
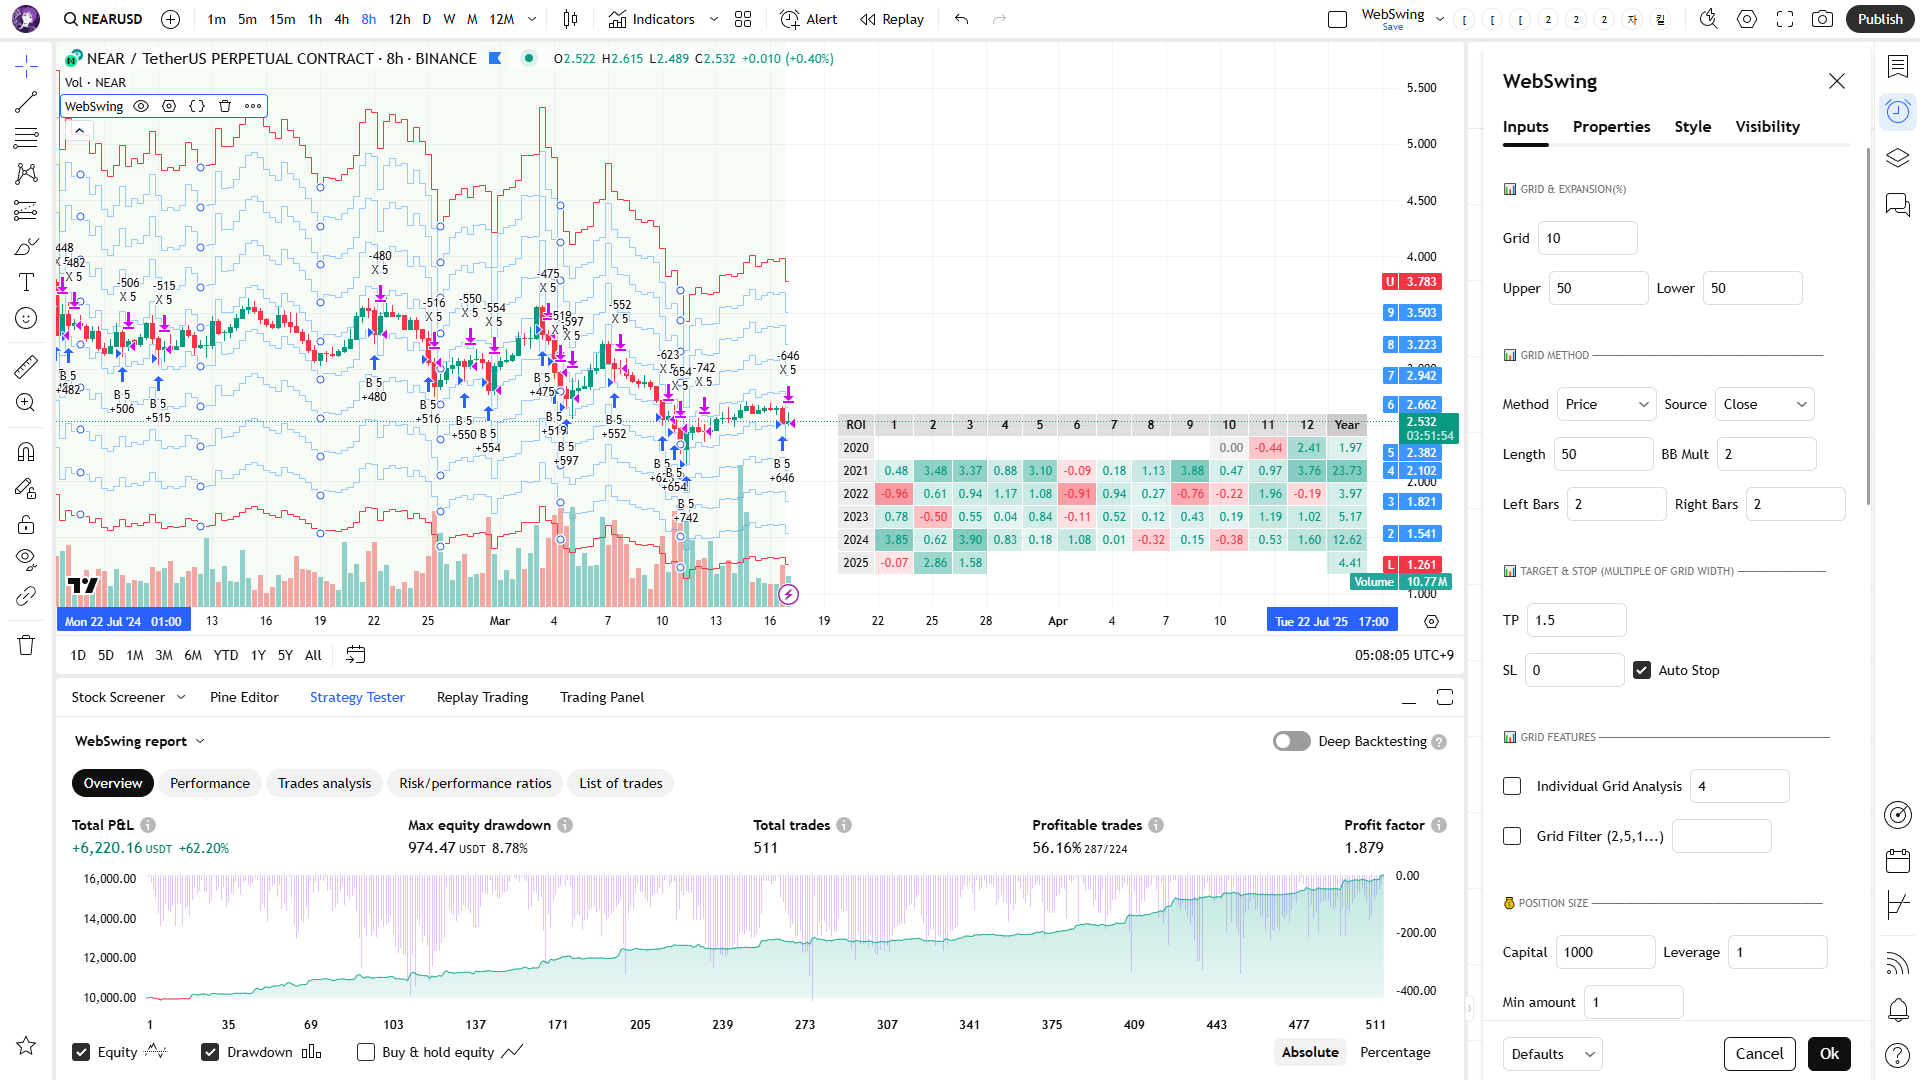
① Default settings
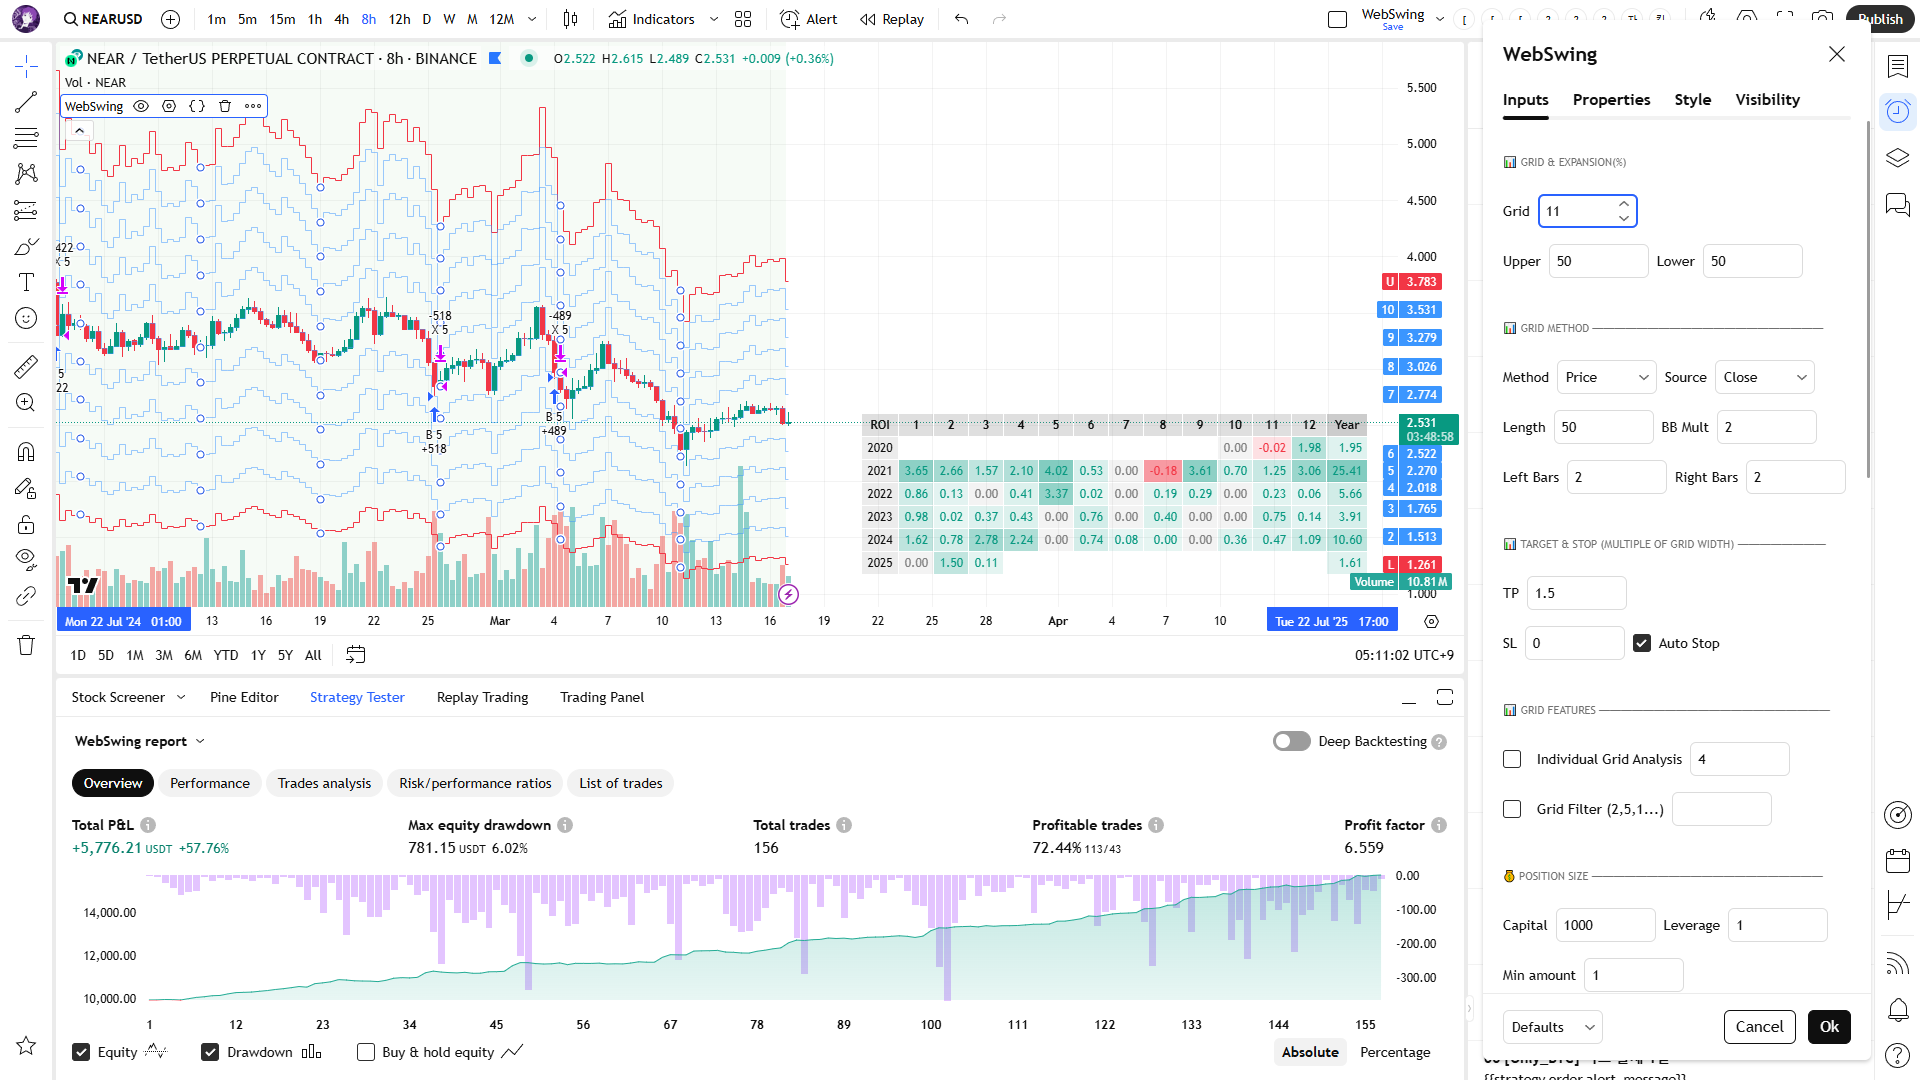
② Grid : 11 (Odd number)
The number of trades can vary significantly depending on whether the number of grids is odd or even. If the number of grids is odd, the grid created at the exact center will be positioned close to the candlestick, which may result in fewer trades. This can also vary depending on the method used. It is important to recognize the characteristics associated with odd and even grid numbers.
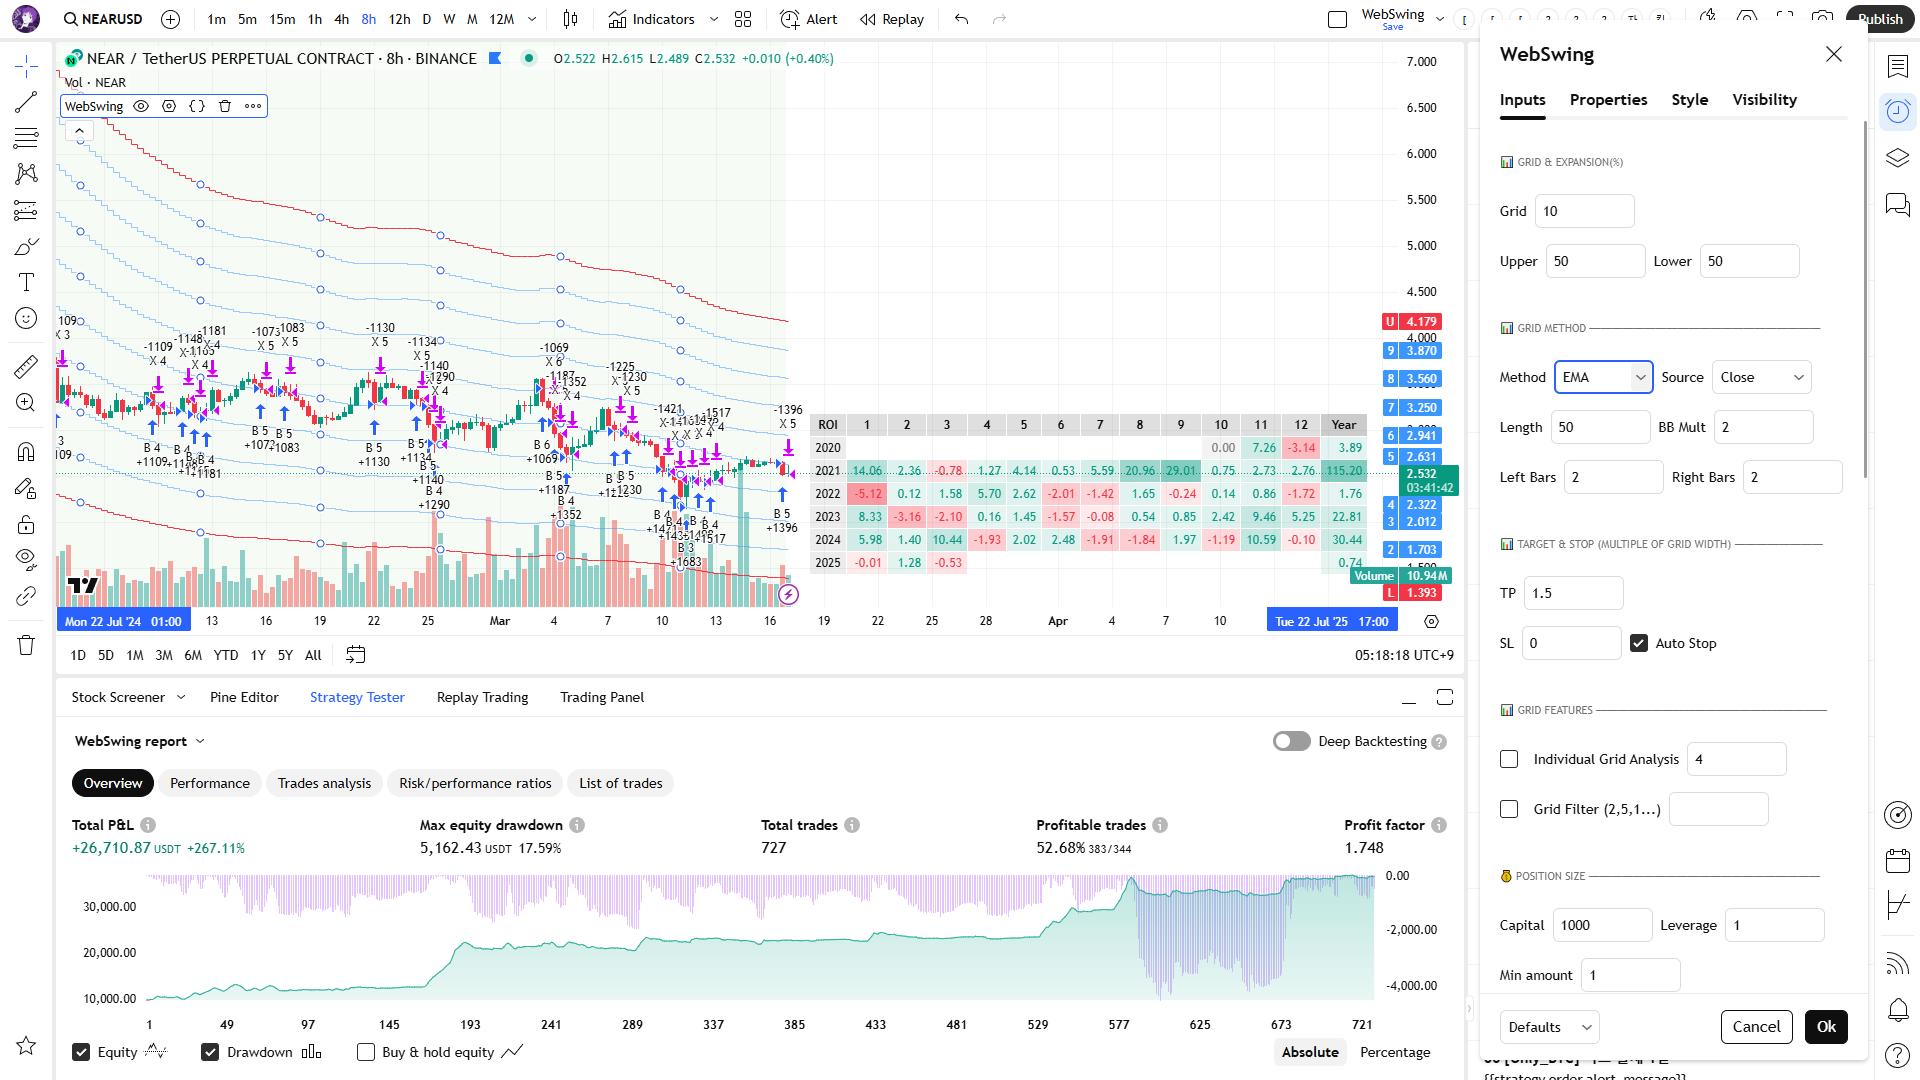
③ Method : EMA
Check how the grid shape changes depending on the method used.
For BB, Donchian, and Pivot, the upper and lower grids are created based on the bands themselves.
For other methods, the grids expand upward and downward based on the indicator.
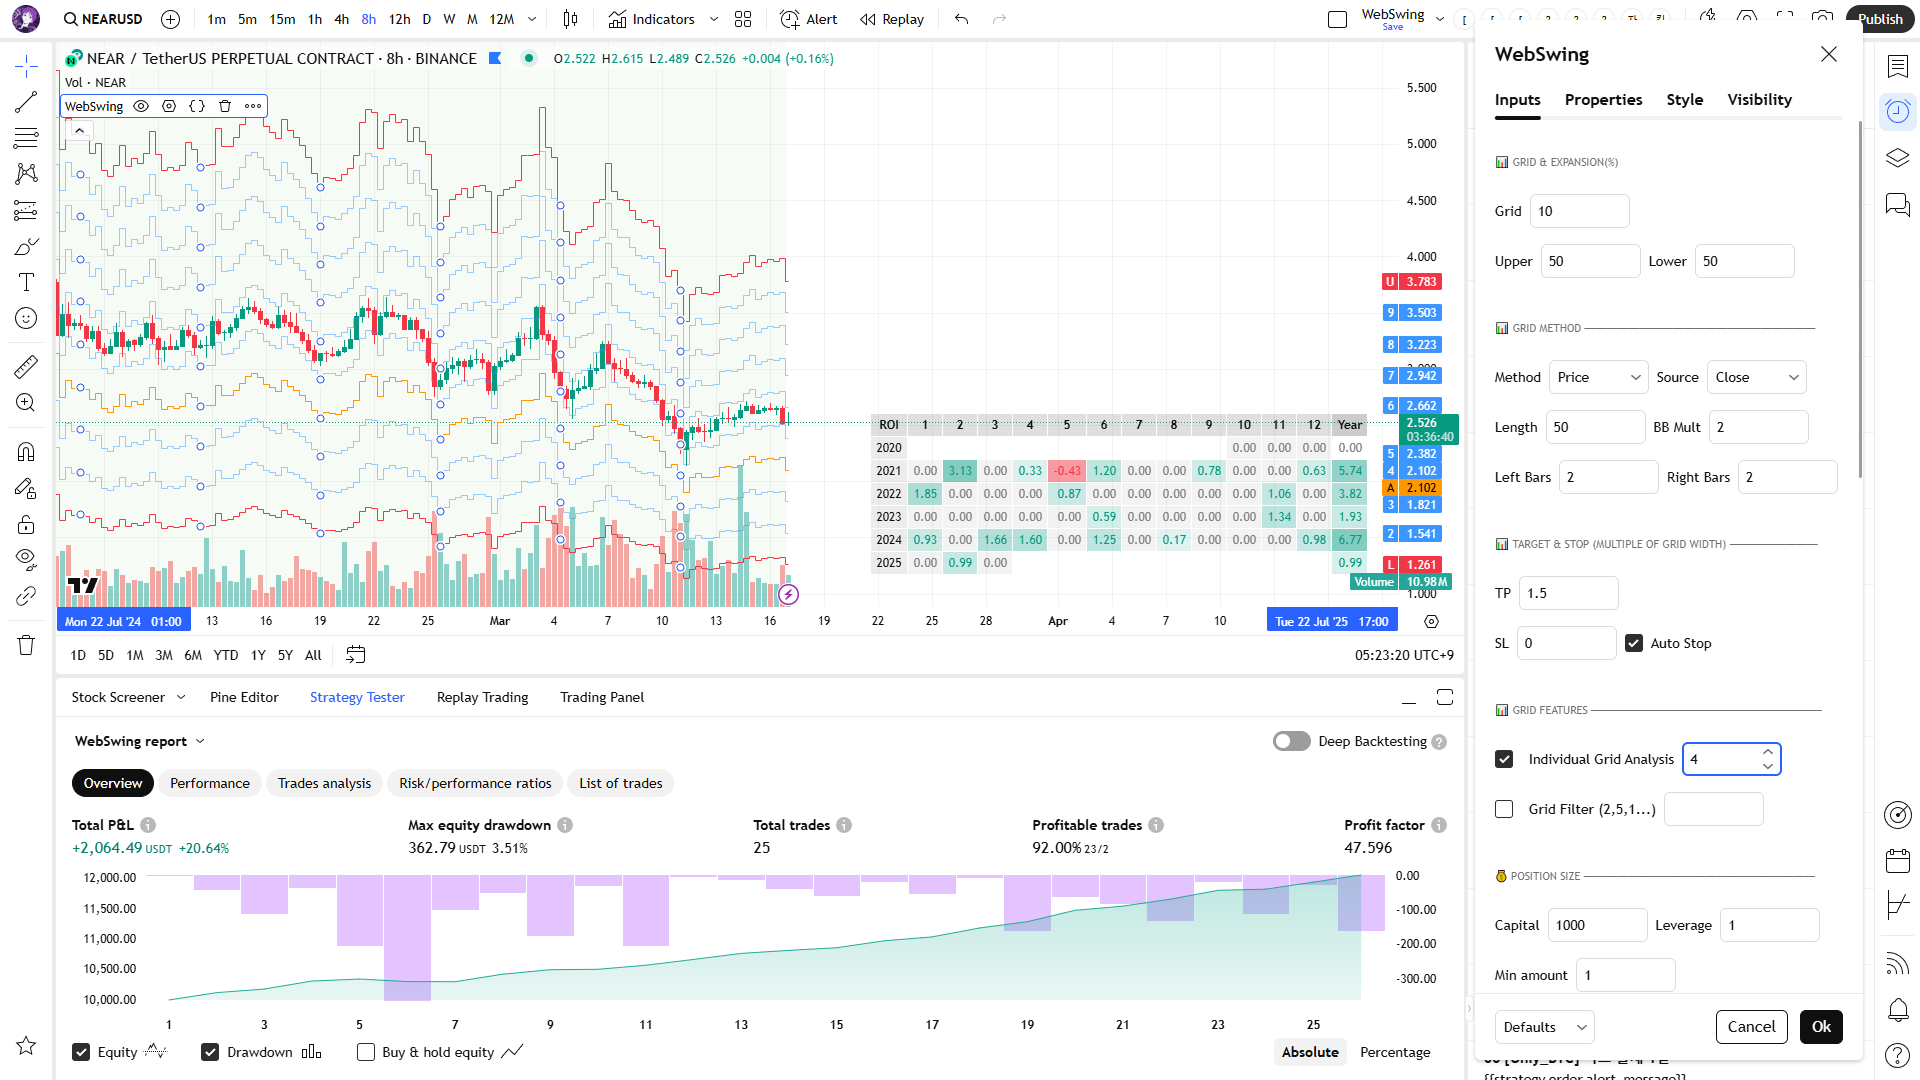
④ Individual Grid Analysis : 4
Use Individual Grid Analysis to check how much trading occurs at each grid level.
In the example on the left, the test created 10 grids, but trades only occurred on grids 2, 3, 4, and 5. Of course, this does not mean that trades will never occur on grids 1, 6, 7, 8, 9, and 10 in the future.
This indicates that trading activity tends to be more concentrated in the central area of the grid.
Out of 10 grids, trades occurred on only 4.
Since most of the trades took place at grid 5, one might consider using leverage in the range of 5 to 10 times.
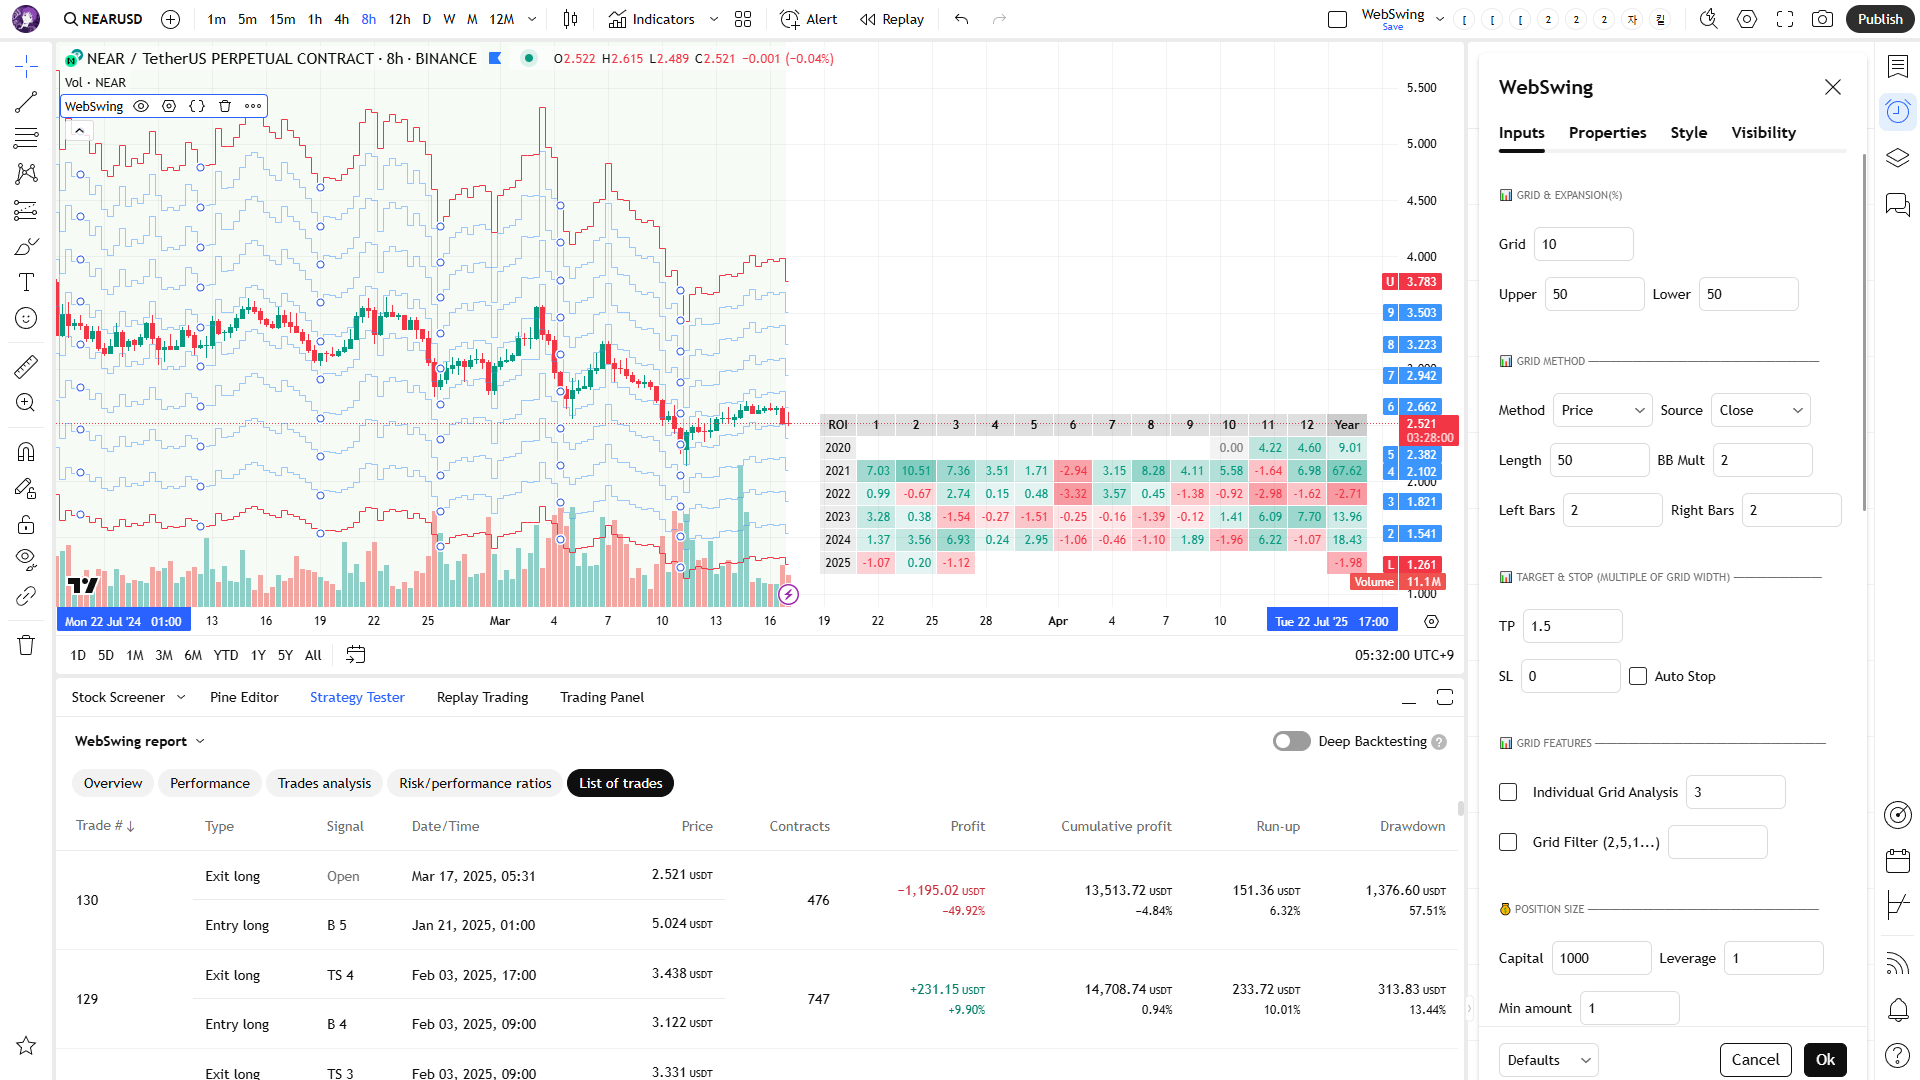
⑤ Auto Stop : False
If the Auto Stop feature is disabled, positions will remain open for an extended period unless they reach the designated stop line.
As a result, some positions may stay open for years. Therefore, it is crucial to check the List of trades to ensure there are no positions left open for too long.
If you don’t mind positions staying open for a long time, you can trade according to the backtest results.
Create your own strategy by experimenting with different methods and settings.
3. Creating Binance Signal Trading
Once you’ve found your desired strategy inputs, use Binance’s signal trading feature to start actual trading.
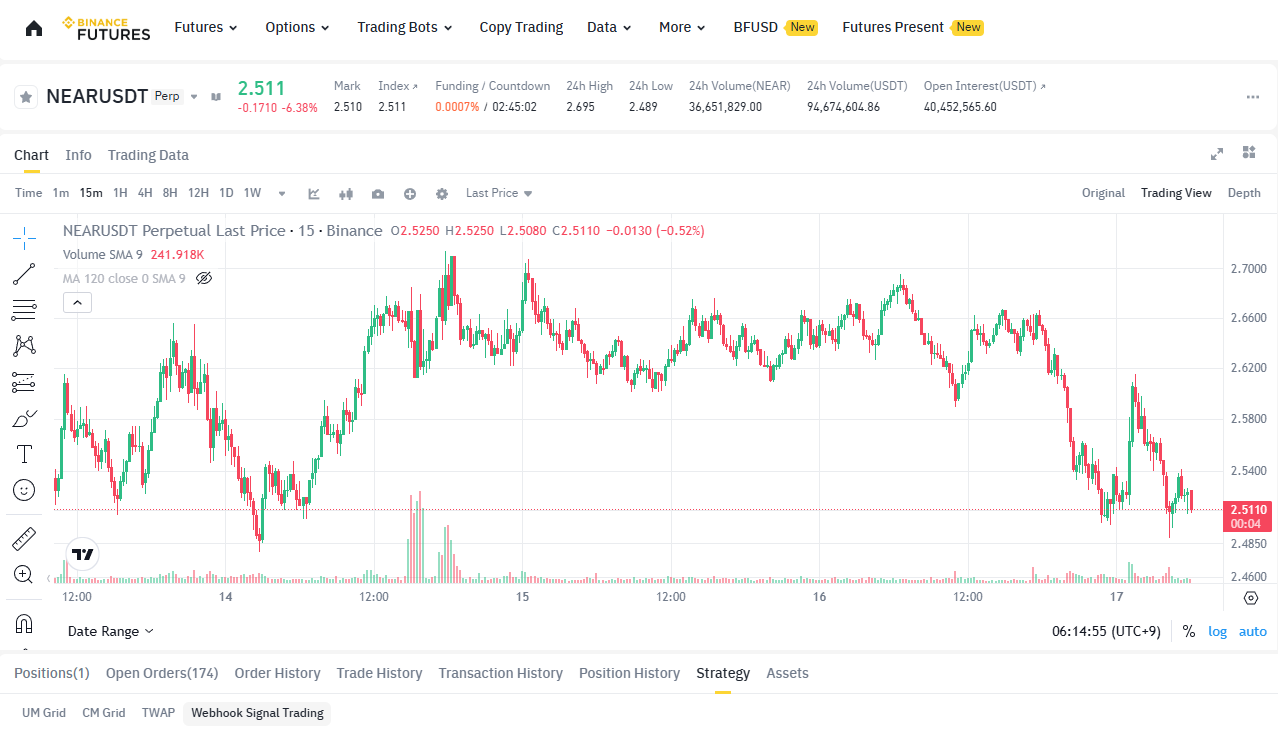
Select Strategy > Webhook Signal Trading at the bottom of the chart.
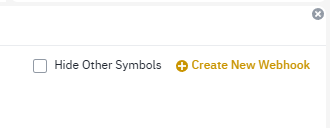
Click Create New Webhook at the far right.

Read the precautions and click Confirm and Proceed.
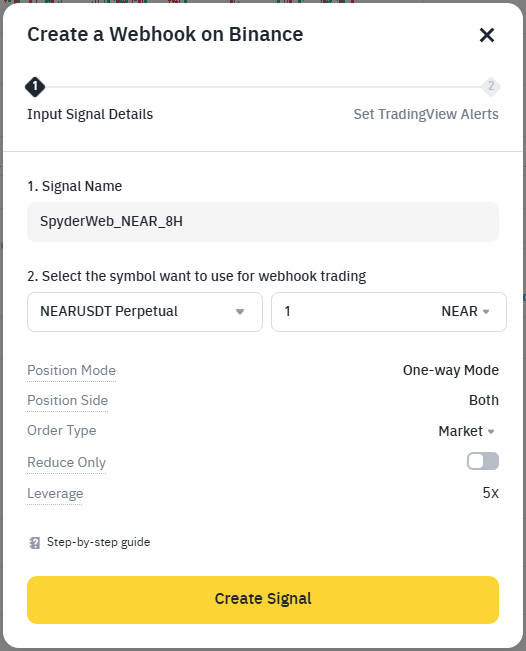
Enter a Signal Name. It is helpful to include the asset, time frame, or input values for easier identification.
Choose the actual asset to trade and enter the quantity, with the default being 1.
The strategy has been tested only in One-way Mode and Market. It cannot be guaranteed to work in other modes, but you can test it yourself. There is no need to modify Reduce Only and Leverage, as they can be adjusted later.
Click Create Signal.
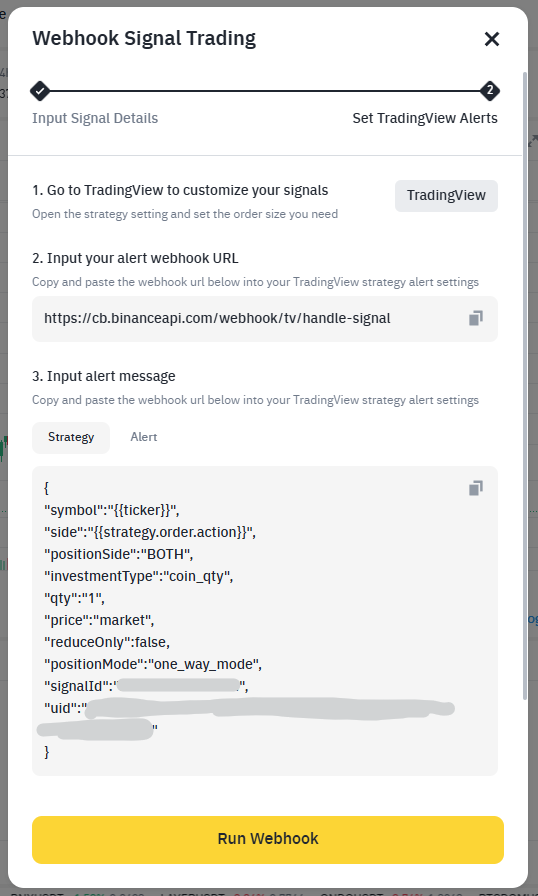
Copy the Webhook URL and Strategy message provided.
The signalId and uid in the Strategy message are unique to you, so do not expose them to others.
Click Run Webhook.
Even if this window closes, you can still view the Webhook URL and Strategy message.
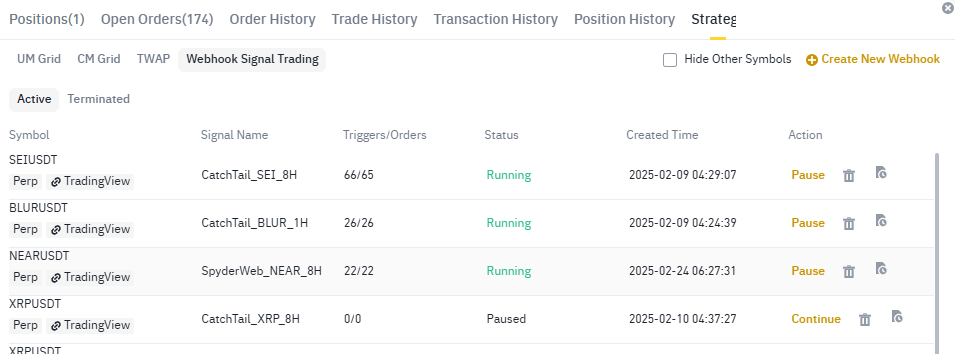
You can check the Webhook Signal Trading you just created.
Click Pause under Action to temporarily stop it.
Even if the webhook signal is delivered, no trade will occur.
Click the Trash icon to delete it, and click the document icon on the right to view the details.
※ SpyderWeb is the previous name of WebSwing.

This shows the details of the signal trading currently being tested for NEAR.
You can view current orders, past orders, and failed orders here.
You can also check the Webhook URL and Strategy message in this section.
4. Setting Up Webhooks for Live Automated Trading
We’re almost there.
If you’ve made it this far, it means you’ve already conducted extensive backtesting on WebSwing. If not, I recommend doing more research on backtesting.
By now, you should have decided on the input values for live trading.
These input values can be changed at any time, so keep refining them through continuous backtesting.
Some input values for backtesting differ from those used in live automated trading.
TradingView does not have access to your exchange balance.
Since it doesn’t know how much you will allocate for trading, you must manually enter that information.
Up until now, backtests have assumed that the total balance was continuously reinvested with compound interest.
To trade using webhooks in real conditions, you need to decide how much of your assets you will allocate to this strategy and input that value accordingly.
Although this process is somewhat inconvenient, I believe it is a reasonable approach that I have found.
1) Setting the Capital
① Capital
Let’s assume you have 5,000 USDT in your account. Now, suppose you want to allocate only 1,000 USDT to this strategy. Additionally, to pursue slightly higher returns, you decide to use 2x leverage. As a result, you will effectively be using 2,000 USDT for this strategy. In this case, you should enter 1,000 in the Capital field.
Make sure to input a value that is smaller than your total exchange balance. Then, disable Backtest Mode. At this point, the backtest results will change. The profit rate will likely decrease because, unlike backtesting—where all funds are continuously reinvested with compound interest—live trading will use only the amount specified in Capital, following a simple interest model.
Now, let’s assume that after one or several trades, you earn a profit of 10 USDT. If you wish to continue with simple interest, you don’t need to make any changes. However, if you want to reinvest profits using compound interest, you must manually update the Capital to 1,010. Conversely, if you lose 10 USDT, you can set Capital to 990.
This is a manual process because TradingView does not track your actual earnings.
Ultimately, you can choose to reinvest the entire 10 USDT or only 5 USDT—it’s entirely up to you. If you anticipate a significant market downturn, you may decide to reduce your Capital or Leverage, or even temporarily pause signal trading altogether
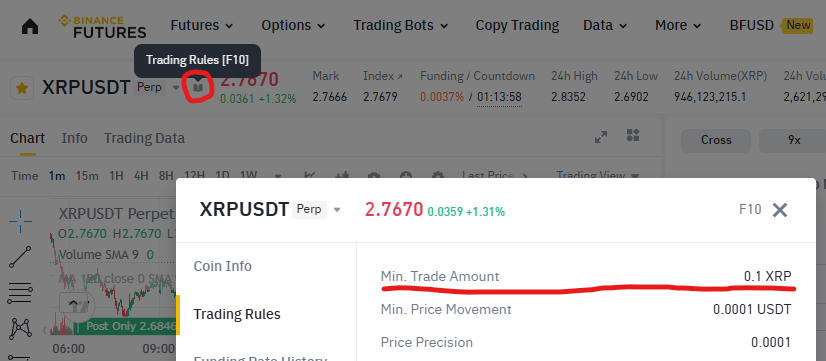
② Min amount
You can check the Min amount by clicking the book icon next to the asset name. Enter this value.
The minimum amount differs for each coin. For example, SOL is 1, and BTC is 0.001.
2) Webhook message
Write the message that will be sent to Binance.
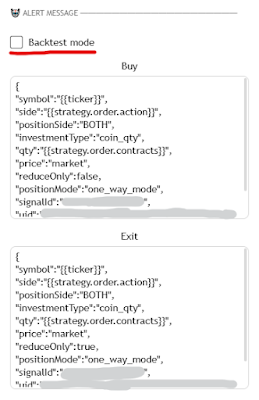
As mentioned earlier, you need to disable Backtest mode.
The Buy message is the one you copied earlier.
The Exit message differs from the Buy message in one aspect: you need to set reduceOnly to true.
Be careful when writing the messages, as they are case-sensitive.
3) Creating Alerts
To create a webhook-based alert, you need at least the Essential level on TradingView.
Additionally, the number of webhooks you can create is limited based on your subscription level.
Optimize the number of webhooks and assets to trade according to your subscription.
Go to the Alerts section on TradingView and click the + button to create a new alert.
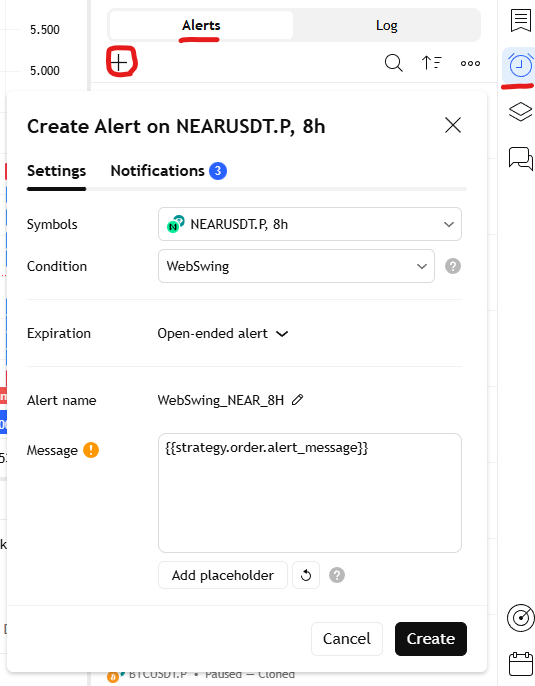
① Settings
Symbols : Select the asset to trade.
Condition : Choose the CatchTail strategy.
Expiration : If you are not on a premium level, the alert will last for a maximum of 2 months, after which you will need to create a new alert (you can extend the period during this time).
Alert name : it is recommended to name the alert based on the coin and time frame.
Message : Simply write {{strategy.order.alert_message}}
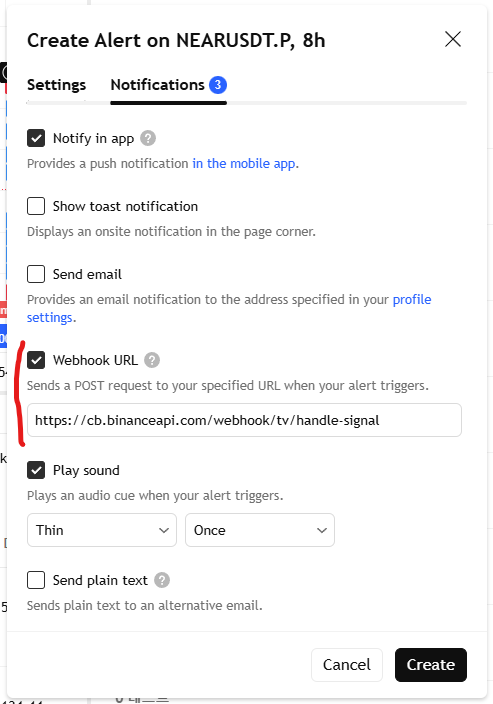
② Notifications
Webhook URL : Check this box and paste the URL you copied from Binance here.
Click Create.
5. Conclusion

Take a look at the results of my 8-day trading with NEAR.
If you’ve set everything up correctly, the quantity on TradingView and the actual quantity traded on Binance should match.
Of course, there may be cases where trades are not executed due to server errors or delays.
If you need to manually close a position, go ahead and do so.
Since this method involves market trading, slippage will occur frequently.
Compare the backtest prices with the actual executed prices.
If necessary, you can test by realistically increasing the slippage in the backtest.
6. Strategy price (USDT, USDC)
| Duration | Regular Price | Discounted Price | Discount Rate |
|---|---|---|---|
| 1 Month | $99 | $99 | 0% |
| 3 Months | $297 | $269 | -9.4% (≒ 9 days free) |
| 6 Months | $594 | $499 | -16.0% (≒ 1 month free) |
| 12 Months | $1,188 | $899 | -24.3% (≒ 3 months free) |
I will offer a 7-day free trial so you can test it before making a payment.
The free trial is limited to 20 users.
If you request a refund during the trial, it will be prorated, and no discount benefits will be applied.
Using this strategy may result in asset losses.
Losses incurred from using this strategy will not be compensated.
Please check the Plan